Calculating wear for tipper bodies
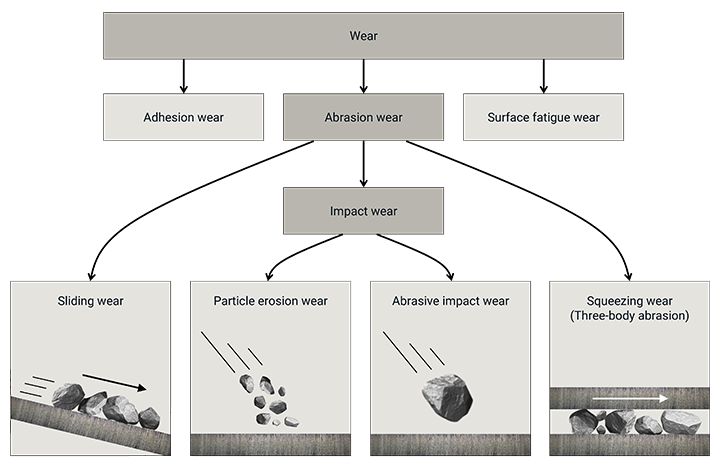
Wear comes in different forms, and each has a different impact on the service life of your tipper body. The most common wear types are sliding wear and impact wear. Each type of rock is composed of a unique set of minerals which contribute to the specific type of abrasive wear damage.
When hard, abrasive rocks and minerals slide over the plate during unloading, this sliding wear mechanism causes material loss and deformation in the body.

Wear of steel can be described as three main categories; adhesion, abrasive wear and surface fatigue. For tipper bodies, sliding wear and abrasive impact wear dominates.
When the tipper is being loaded, the body is subjected to impact wear. Only a few large rocks will hit the tipper floor and cause impact wear; the remaining rocks will hit the loaded rocks and not directly the floor. This means that the majority of the wear in a tipper comes from sliding wear, which occurs when unloading the tipper.
Depending on the hardness of the plate relative to the hardness of the abrasive materials loaded, such as aggregate, rocks, metal scrap, etc., relative wear can be calculated using the Hardox® WearCalc software. The Hardox® WearCalc app is a powerful prediction tool that calculates wear and helps you optimize your choice of wear steel. It allows you to predict relative wear life and compare different wear solutions.

Hardox® WearCalc desktop app (left) and Hardox® WearCalc mobile app (right).
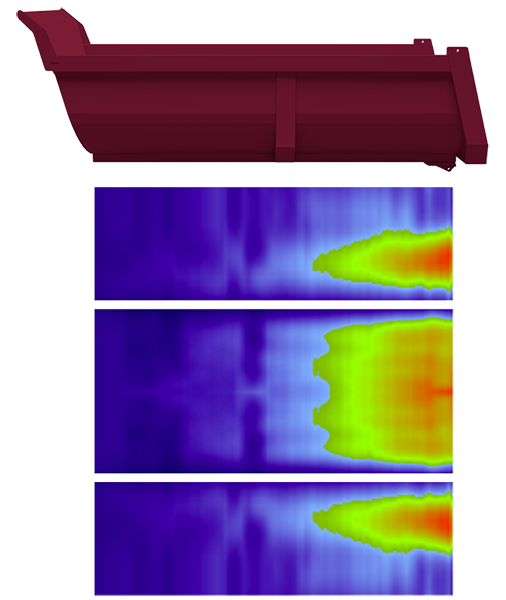
Wear map of tipper bodies
Sliding wear relative to steel hardness
There are two basic mechanisms during sliding wear that take place when a load is discharged – cutting wear and plowing wear. Ideally we will always try to stay in the plowing zone as much as possible, since this will cause the least amount of wear. As a general approximation, the transition between severe cutting wear and slower plowing wear takes place when the abrasive material is less than 1.8–2.1 times harder than the steel’s hardness.
For granite, this transition to slow wear starts at a steel hardness of about 340 HBW as shown in the graph below, and then drops rapidly as the hardness of the steel increases.
The graph shows the sliding wear rate for granite. Because of the way the steel interacts with the minerals in granite, the transitions will occur at different steps. The top red dotted line describes the cutting mechanism and the bottom gray dotted line describes the plowing curve. The solid black line indicates the wear rate and transitions from minerals interacting with the steel.

Sliding wear rate showing the cutting mechanism (red dotted line), the plowing mechanism (gray dotted line) and the wear rate (black solid line). The result for specific abrasive material and steel grade combinations can be calculated with Hardox® WearCalc.
The information in this report is only applicable to SSAB’s products and should not be applied to any other products than original SSAB products.
This report provides general results and recommendations for SSAB steel products. This report is subject to SSAB’s Terms of Use. It shall be the user's responsibility to verify that the information contained herein is correct and is suitable to be used for the particular purpose and application of the user. The report is intended to be used by professional users only who possess adequate expertise, qualification and knowledge for the safe and correct use of the results and recommendations in this report. This report is provided “as is”. The use of the report is at user’s own discretion and risk and that users will be solely responsible for any use of this report. SSAB disclaims any liability for the content or potential errors of this report, including but not limited to warranties and condition of merchantability or fitness for a particular purpose or suitability for individual applications. SSAB shall not be liable for any kind of direct or indirect damages and/or costs related to or arising therefrom, whether special, incidental, consequential or directly or indirectly related to the use of, or the inability to use, the report or the content, information or results included therein.
